



 10 minutes to read
2026-04-08
Saira Khan
Trend Investing on ExpertOption: A Beginner-Friendly Guide to Market Analysis


Financial markets often move in recognizable patterns over time. Prices may rise steadily during periods of optimism, decline as sentiment weakens, or move sideways while the market searches for direction. For traders, identifying these movements early can help structure decisions and approach market analysis with greater clarity.
This concept is known as trend investing. Instead of predicting every short-term fluctuation, traders focus on identifying broader momentum and aligning their positions with the prevailing direction.
For many beginners, however, trend analysis can feel confusing. Charts may appear crowded with indicators, technical terms can seem overwhelming, and identifying the difference between a temporary pullback and a real trend reversal is not always straightforward.
Platforms like ExpertOption aim to simplify this process by presenting market data in a clear and accessible format, helping users interpret price movements more easily. The platform is widely known as a beginner-friendly platform with simple investing tools, designed to present market data in a clear and visual format. By combining accessible technical charting with straightforward navigation, the interface helps users follow price direction without unnecessary complexity.
This guide explains how trend investing works on ExpertOption, how traders typically identify market momentum, and which tools can help beginners interpret price movement with greater clarity.
Visit our website to explore the platform and create your account.
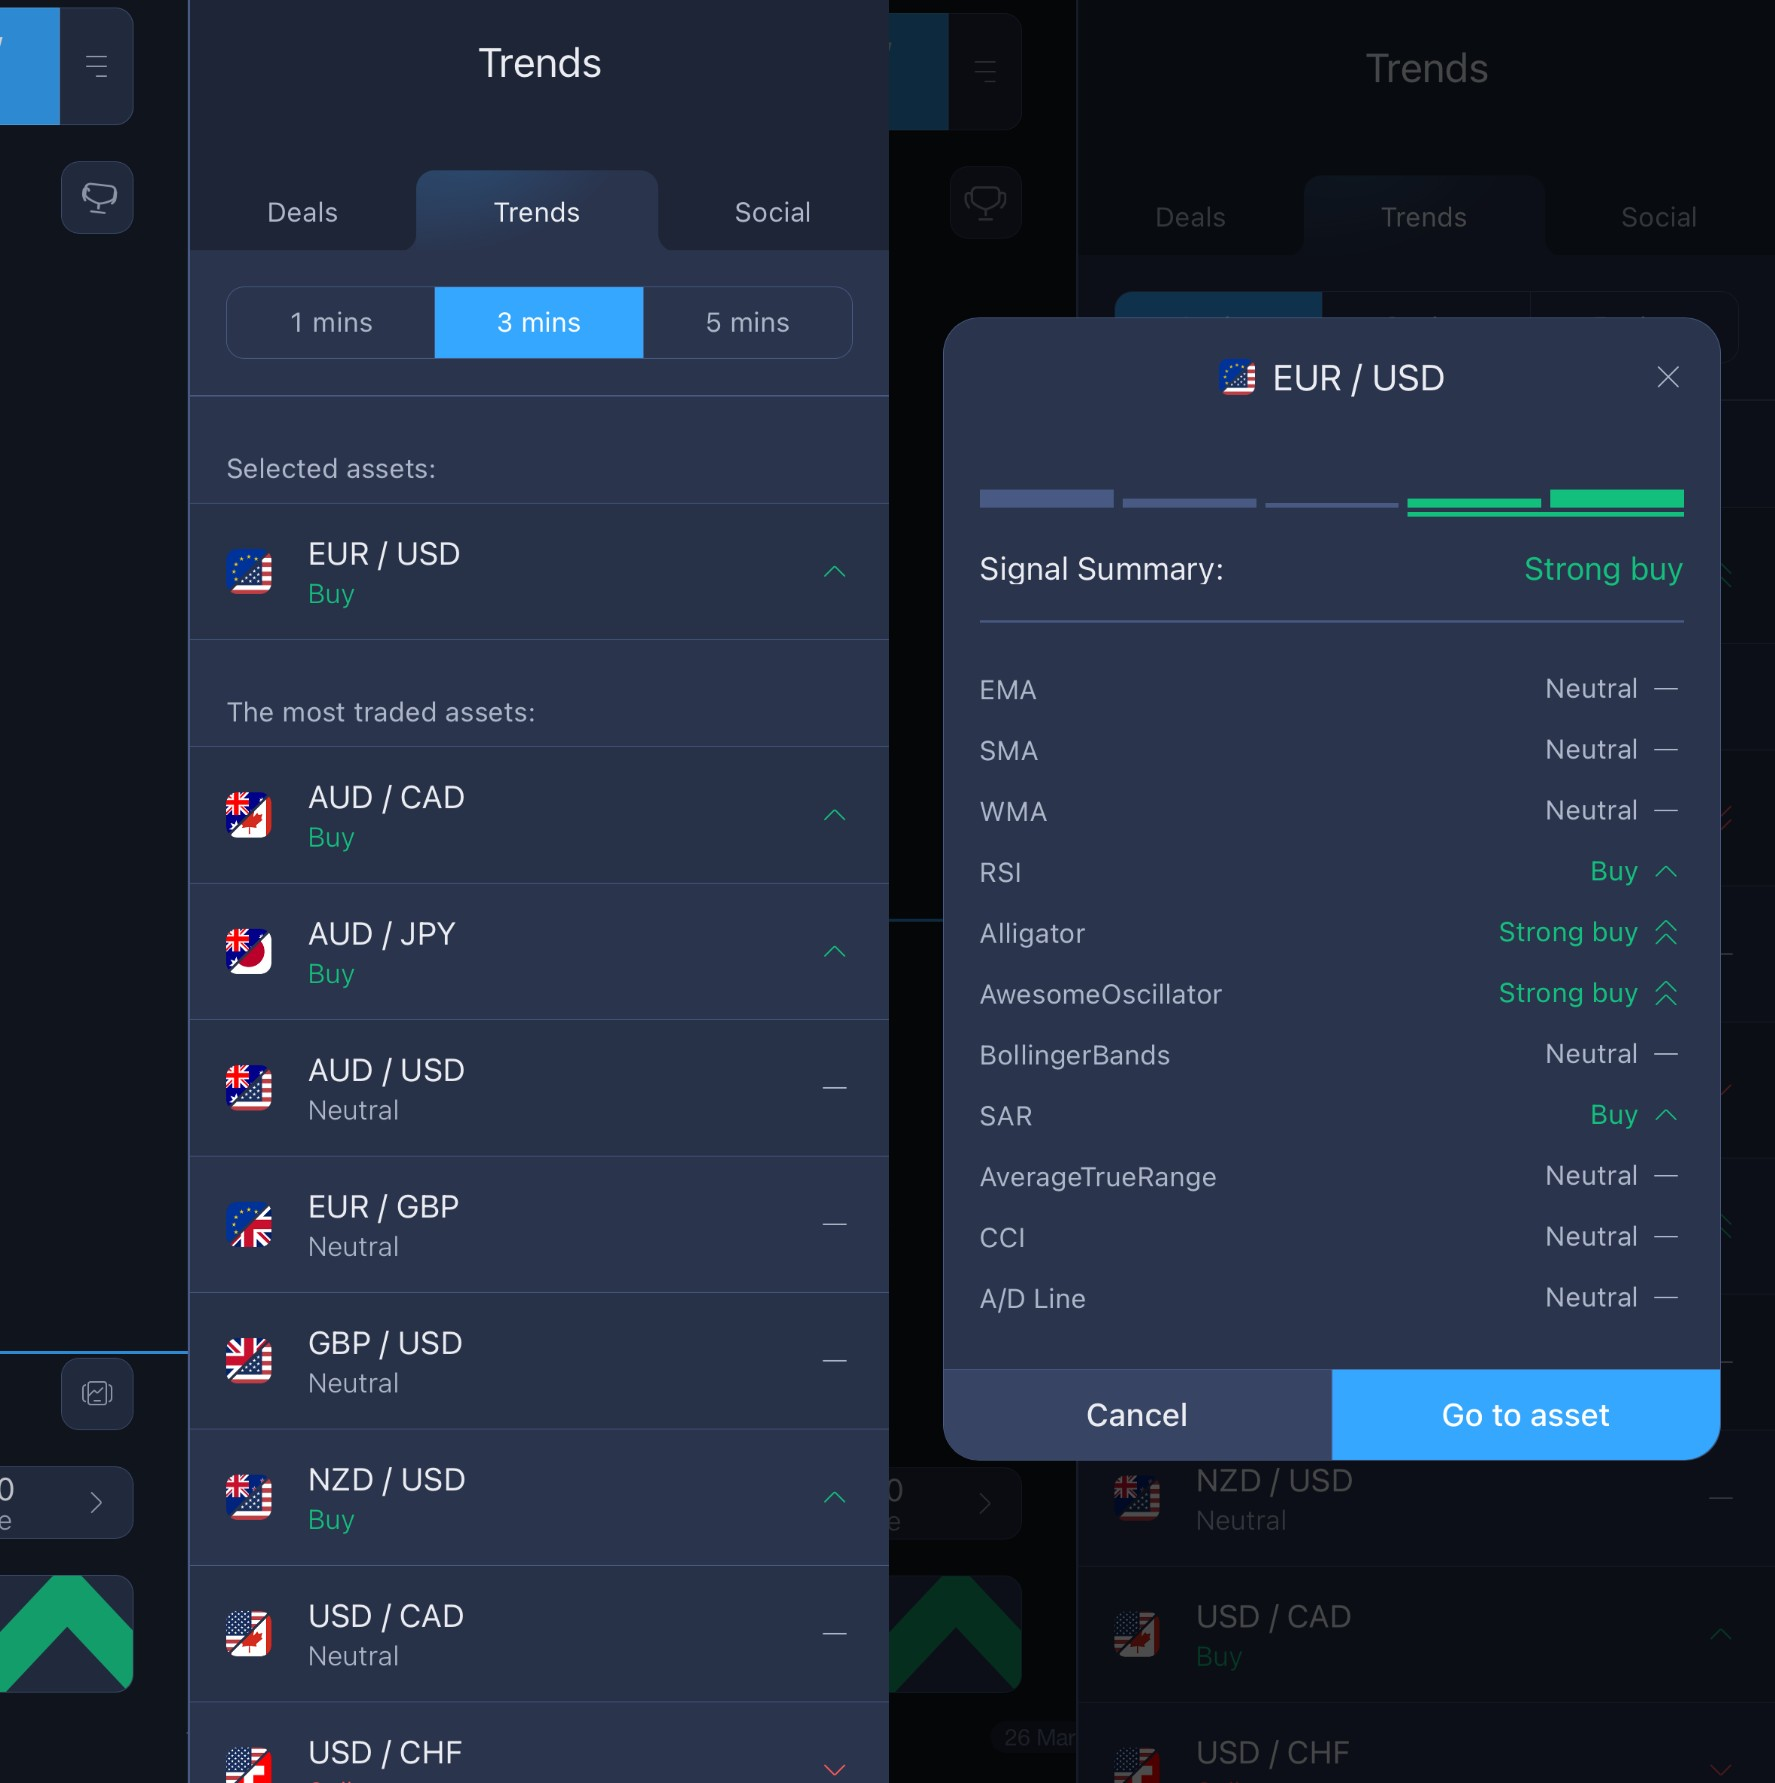
Understanding How Trends Form on ExpertOption
At its core, a trend represents the general direction of price movement over time. In most markets, trends emerge because of changing supply and demand conditions, economic data releases, geopolitical developments, or shifts in investor sentiment.
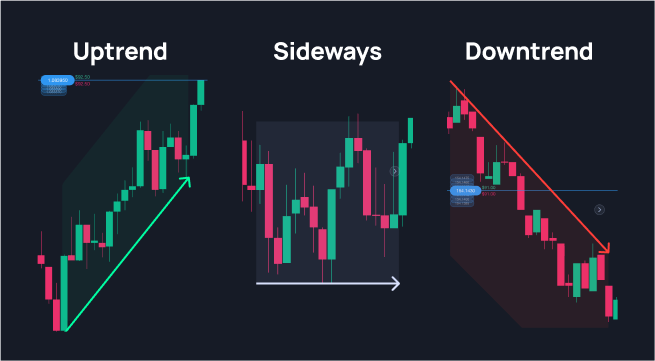
When analyzing markets on ExpertOption, traders generally encounter three primary trend conditions.
Bullish Trends
A bullish trend occurs when prices move upward over time. This usually happens when demand for an asset increases and buyers are willing to purchase at higher prices.
Typical characteristics of a bullish trend include:
- Higher highs and higher lows on the price chart
- Strong buying activity during pullbacks
- Positive sentiment around the underlying asset
For example, if technology stocks begin rising after strong earnings reports, a bullish trend may form as investors react to improved expectations.
Bearish Trends
A bearish trend is the opposite scenario. Prices gradually move downward as pressure from sellers outweighs buying interest.
On charts, bearish momentum often appears as:
- Lower highs and lower lows
- Increasing selling volume during rallies
- Negative sentiment surrounding economic or company-specific developments
Bearish trends frequently occur during periods of economic uncertainty or when markets adjust to negative news.
Sideways Markets
Not all markets trend strongly. Sometimes prices fluctuate within a narrow range without a clear direction.
This environment is often called consolidation or a sideways market.
During these phases:
- Prices move between support and resistance levels
- Breakouts are less reliable
- Market momentum remains weak
Recognizing these conditions is important because trend-based strategies are usually more effective when a clear direction exists.
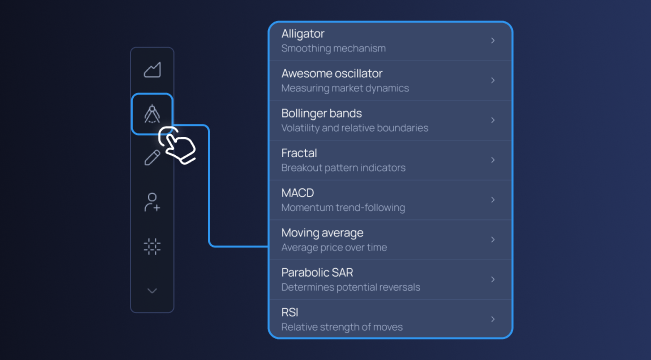
Tools That Help Identify Trends
On ExpertOption, traders rely on a combination of price action, indicators, and visual chart analysis to determine whether a trend is forming.
Several commonly used tools help confirm market momentum.
Moving Averages
Moving averages are among the most widely used indicators in technical charting. They smooth out price fluctuations by calculating the average price over a specific period.
Two common types include:
- Short-term moving averages (for example, 10- or 20-period)
- Long-term moving averages (such as 50- or 100-period)
When a shorter moving average crosses above a longer one, traders often interpret it as a sign of strengthening bullish momentum. When the opposite occurs, it may indicate bearish pressure.
Breakout Zones
Markets frequently trade within defined price ranges before eventually breaking out.
A breakout occurs when the price moves decisively above resistance or below support.
Breakouts can signal the beginning of a new trend because they indicate that buyers or sellers have gained control of the market.
For example:
- A stock repeatedly tests a resistance level at $50
- Eventually, the price breaks above that level with strong momentum
- The breakout may trigger additional buying interest
Price Action
While indicators can be helpful, many experienced traders also rely on price action — the direct observation of how prices move.
Price action analysis involves watching:
- Trendlines
- Support and resistance levels
- Candlestick formations
- Momentum shifts
ExpertOption’s charts allow traders to examine these elements clearly, which can help beginners understand how trends evolve in real time.
Why an Intuitive Interface Changes Everything
Many professional trading platforms offer extensive analytical capabilities, but they can feel overwhelming for new users. Screens filled with dozens of indicators, multiple windows, and advanced tools may create confusion rather than clarity.
A user-friendly platform can significantly improve the learning process.
ExpertOption focuses on presenting market data in a visually structured way. The platform’s charts, indicators, and asset lists are organized so users can quickly access the information needed for market analysis.
Some practical benefits of this approach include:
1. Clear Chart Visualization
A simplified chart layout makes it easier to identify trend direction without unnecessary distractions.
Traders can quickly observe:
- Higher highs and higher lows in bullish trends
- Lower highs and lower lows in bearish trends
- Consolidation patterns in sideways markets
2. Faster Decision-Making
When markets move quickly, traders often need to evaluate information in seconds. A clean interface helps reduce the time required to interpret data.
This clarity can be particularly helpful when monitoring trading momentum during volatile periods.
3. Reduced Risk of Misinterpretation
Cluttered charts sometimes lead traders to rely on too many indicators simultaneously. This can result in conflicting signals and uncertainty.
By focusing on a manageable set of tools, users can build a clearer understanding of price behavior.
Key Benefits of a Structured Trend-Investing Approach
Many beginners initially approach trading without a defined framework. They may react emotionally to price movements or attempt to predict short-term fluctuations without a broader strategy.
A structured trend investing approach helps create discipline
Rather than guessing market direction, traders focus on recognizing patterns and aligning their decisions with established momentum.
Some practical advantages of this approach include:
- Clearer market perspective: Trends provide context for price movement, helping traders understand whether a market is gaining strength or weakening.
- Improved timing awareness: Observing pullbacks within trends may help traders recognize potential entry opportunities.
- More consistent analysis: Following a defined process reduces impulsive decisions.
For example, a trader analyzing a bullish trend may wait for a temporary pullback toward a moving average before evaluating the next potential move.
This type of structured thinking helps transform market observation into a repeatable analytical process.
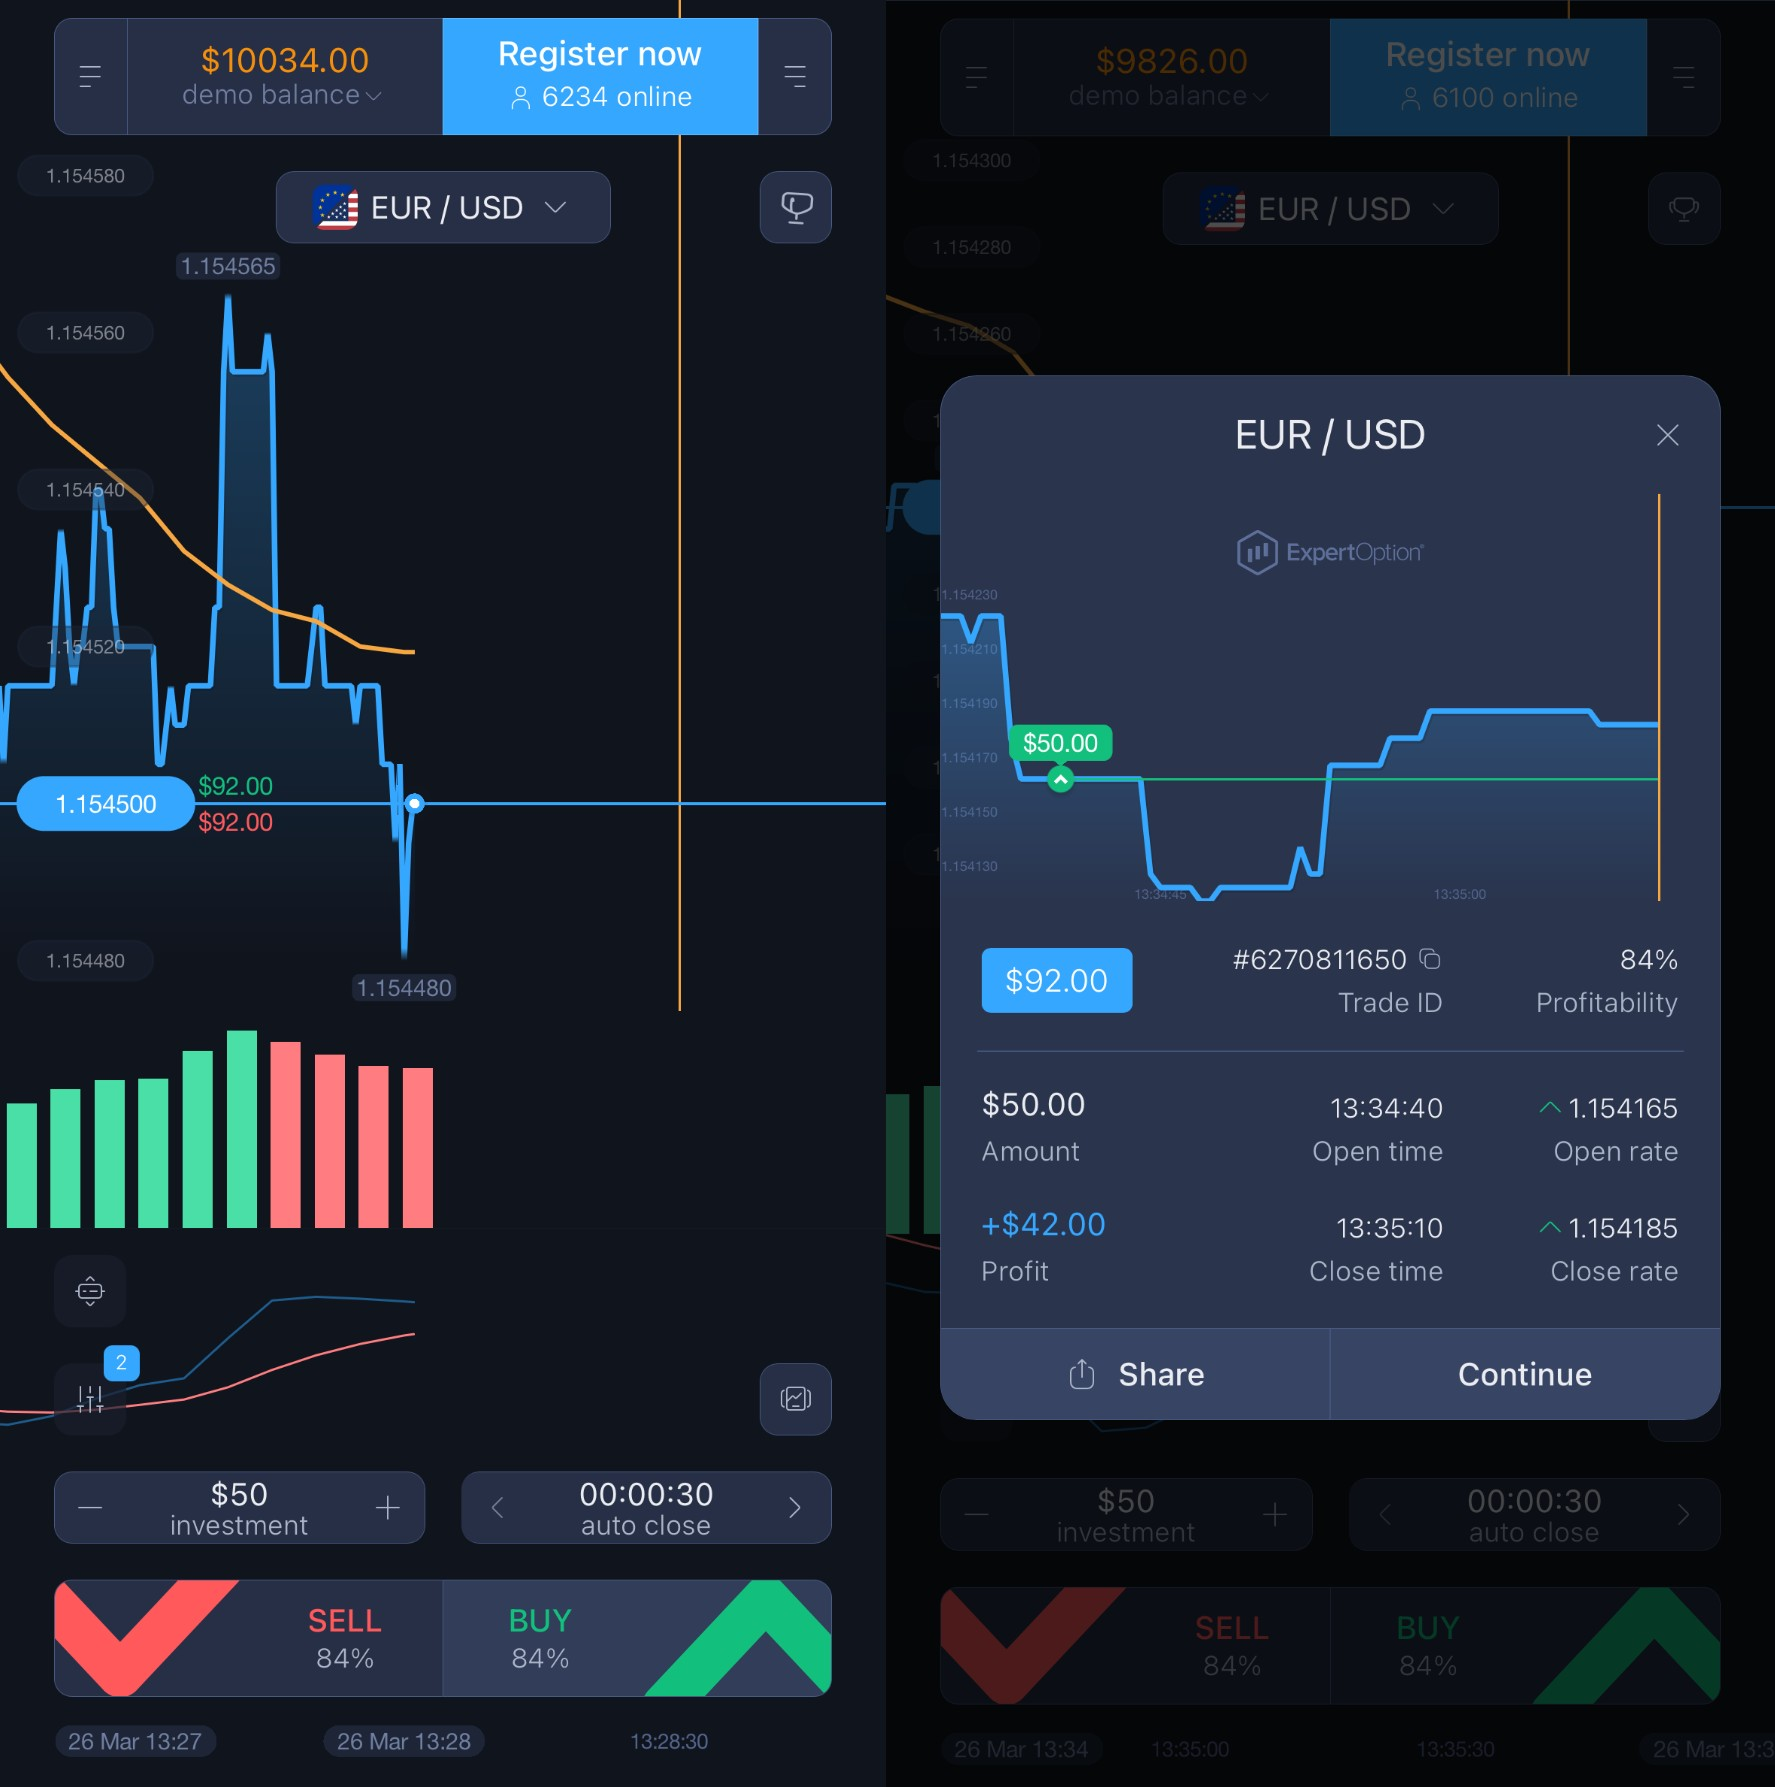
Who Should Follow This Guide
Trend investing can be useful for many types of traders, but it’s especially helpful for those who prefer a structured approach to market analysis.
This guide may be particularly relevant for:
- Beginners learning chart interpretation: New traders often feel overwhelmed by technical indicators. Focusing on trend direction simplifies the learning process.
- Users exploring a beginner-friendly platform: ExpertOption’s visual charts and simple investing tools allow new users to observe price movement without needing advanced technical knowledge.
- Traders seeking more discipline: Following market trends encourages patience and structured analysis rather than impulsive decision-making.
- Those interested in understanding market momentum: Trend analysis helps traders recognize how sentiment shifts influence asset prices.
Common Mistakes to Avoid When Following Trends
Although trend investing is conceptually simple, beginners sometimes encounter challenges when applying it in practice.
Recognizing common mistakes can help traders approach markets more carefully.
1. Entering Trades Without Confirming Direction
Some traders assume a trend exists without verifying the underlying price structure. Waiting for confirmation through price action or indicators can provide additional context.
2. Relying on a Single Indicator
Indicators can support analysis, but they work best when combined with broader chart interpretation. Observing support levels, resistance zones, and trendlines helps create a more balanced perspective.
3. Ignoring Pullbacks
Even strong trends rarely move in straight lines. Temporary retracements are normal and often occur before the trend continues.
Mistaking these pullbacks for reversals can lead to unnecessary reactions.
4. Trading During Sideways Markets
Trend strategies work best when markets show a clear direction. In consolidation phases, price movement may become unpredictable.
5. Misreading Short-Term Noise
Short-term volatility can sometimes appear like the start of a new trend. Observing multiple timeframes helps traders avoid confusing temporary fluctuations with long-term momentum.
FAQs
What is trend investing?
Trend investing is a trading approach that focuses on identifying the general direction of a market and aligning positions with that momentum rather than predicting every short-term fluctuation.
Is ExpertOption suitable for beginners?
ExpertOption is often described as a beginner-friendly platform because its interface prioritizes visual clarity and straightforward navigation, making it easier for users to interpret market data.
Which tools help identify trends?
Common tools include moving averages, trendlines, breakout levels, and price action analysis. These elements help traders evaluate trading momentum and confirm market direction.
Can trends change quickly?
Yes. Market trends can shift when new economic information appears, when investor sentiment changes, or when large market participants adjust their positions.
Why do traders combine indicators with price action?
Indicators summarize historical price data, while price action shows real-time movement. Using both together can provide a broader view of market behavior.
What is the difference between a pullback and a reversal?
A pullback is a temporary movement against the main trend, while a reversal indicates a more significant change in direction. Observing chart structure over time helps traders distinguish between the two.
You can explore helpful information about the platform in our blog.
Bottom Line
Understanding market trends is one of the most practical skills traders can develop. By observing price direction, momentum shifts, and breakout levels, traders gain a clearer perspective on how markets behave.
Platforms like ExpertOption provide an environment where these observations can be made more easily. With technical charting, clear visual layouts, and simple investing tools, the platform supports traders who want to explore trend investing without navigating overly complex interfaces.
As with any trading method, success depends on discipline, patience, and continuous learning. Recognizing trends, confirming signals, and avoiding common mistakes can help traders approach markets with greater structure and confidence.
For beginners, exploring chart patterns on a user-friendly platform is often the first step toward understanding how market momentum develops — and how trends shape the movement of global financial assets.
Latest Posts
Trading Education
Trading News
Trading Strategies
Promotions & Tournaments
Success Stories & Tips
Platform Updates
Global events, stocks, crypto, forex
ExpertOption Reviews: An Honest Overview and Tips from Traders
5 minutes to readExpertOption Withdrawal Policy: How Withdrawals Work and Why Balance Management Matters
5 minutes to readExpertOption Reviews: An Honest Overview and Tips from Traders
5 minutes to readExpertOption Withdrawal Policy: How Withdrawals Work and Why Balance Management Matters
5 minutes to read